Dynamic Open Graph (OG) image generation using Next.js, Sanity & Mapbox
7 months agoWhy do we need OG images?
Open Graph (OG) images are essential for making your content stand out when shared across various digital platforms. They serve as the visual preview that accompanies a link, acting as the first impression users get before they decide whether to click through. While most people associate OG images with social media platforms like Facebook and Twitter, their utility extends far beyond that. These images enhance link previews in messaging apps like WhatsApp and Slack, making shared links more engaging and informative.
For my personal project, NZHikes.com, which showcases a wide range of hiking trails across New Zealand, I recognised the need for dynamic OG images. These images not only needed to capture the essence of each hike but also convey key information at a glance. I envisioned OG images that would display a map of each hike, along with essential details like the region, distance, elevation gain and duration. Such images would make the hike details visually appealing and instantly recognisable, whether shared on a social media, or pasted into a group chat. Here's how I achieved this using a combination of Next.js, Mapbox, and Sanity.
Leveraging Next.js OG Image Generation
To create dynamic OG images, I utilized Vercel's @vercel/og library, which allows for real-time OG image generation using Vercel Edge Functions. This library is a game-changer for developers looking to generate unique images based on content-specific data. The image generation process is both flexible and efficient, enabling real-time creation of visually appealing OG images that perfectly match the shared content.
For NZHikes.com, where each hiking trail has its own set of attributes like difficulty, length, and geographic location, static images wouldn’t suffice. The dynamic nature of the OG images meant that every shared link would generate a customized image, ensuring that the preview is always relevant and up-to-date.
Getting Started with Vercel's @vercel/og Library:
To kick off the process, you need to install the @vercel/og package. This can be easily done using your preferred package manager. Here’s how to install it with pnpm:
1pnpm i @vercel/ogOnce installed, you can set up an API endpoint in your Next.js application. In my project, I created a new API route under the /app/api/og directory. This route is responsible for handling requests and generating the OG images on-the-fly.
Creating OG Images for Landing Pages
For NZHikes.com, I had two different types of pages: landing pages and detailed hiking pages. Let’s start with the landing pages.
Dynamic Title and Hero Image:
For each landing page, I wanted the OG image to feature a dynamically generated title based on the page slug and to fetch the hero image associated with that page from Sanity. This approach allows each landing page to have a unique and visually consistent OG image that reflects its content.
Here's an example of how I implemented this in the route.tsx file under /app/api/ogPage:
1import { loadHomePage, loadPage } from '@/sanity/loaders/loadQuery';
2import { ImageResponse } from 'next/og';
3
4export const runtime = 'edge';
5
6export async function GET(request: Request) {
7  const { searchParams } = new URL(request.url);
8  const slug = searchParams.get('slug');
9  const { data } = slug ? await loadPage(slug as string) : await loadHomePage();
10  const imageUrl = data.heroImage.asset.url;
11
12  const fontData = await fetch(
13    new URL('public/fonts/Epilogue-Bold.ttf', import.meta.url),
14  ).then((res) => res.arrayBuffer());
15
16  return new ImageResponse(
17    (
18      <div
19        style={{
20          display: 'flex',
21          flexDirection: 'column',
22          alignItems: 'center',
23          justifyContent: 'center',
24          width: '100%',
25          height: '100%',
26          backgroundColor: '#f6f6f6',
27          position: 'relative',
28        }}
29      >
30        <img
31          width='1200'
32          height='630'
33          alt='NZ Hikes'
34          src={imageUrl}
35          style={{
36            objectFit: 'cover',
37            borderBottomLeftRadius: '10%',
38          }}
39        />
40        <div
41          style={{
42            position: 'absolute',
43            top: 0,
44            left: 0,
45            right: 0,
46            bottom: 0,
47            display: 'flex',
48            flexDirection: 'column',
49            justifyContent: 'space-between',
50            padding: '64px',
51          }}
52        >
53          <h1
54            style={{
55              fontSize: '50px',
56              fontWeight: 'bold',
57              color: 'white',
58              margin: 0,
59            }}
60          >
61            NZ Hikes
62          </h1>
63          <p
64            style={{
65              fontSize: '150px',
66              fontWeight: 'bold',
67              color: 'white',
68              margin: 0,
69              alignSelf: 'flex-end',
70            }}
71          >
72            /{slug || 'home'}
73          </p>
74        </div>
75      </div>
76    ),
77    {
78      width: 1200,
79      height: 630,
80      fonts: [
81        {
82          name: 'Epilogue',
83          data: fontData,
84          style: 'normal',
85        },
86      ],
87    },
88  );
89}
Explanation:
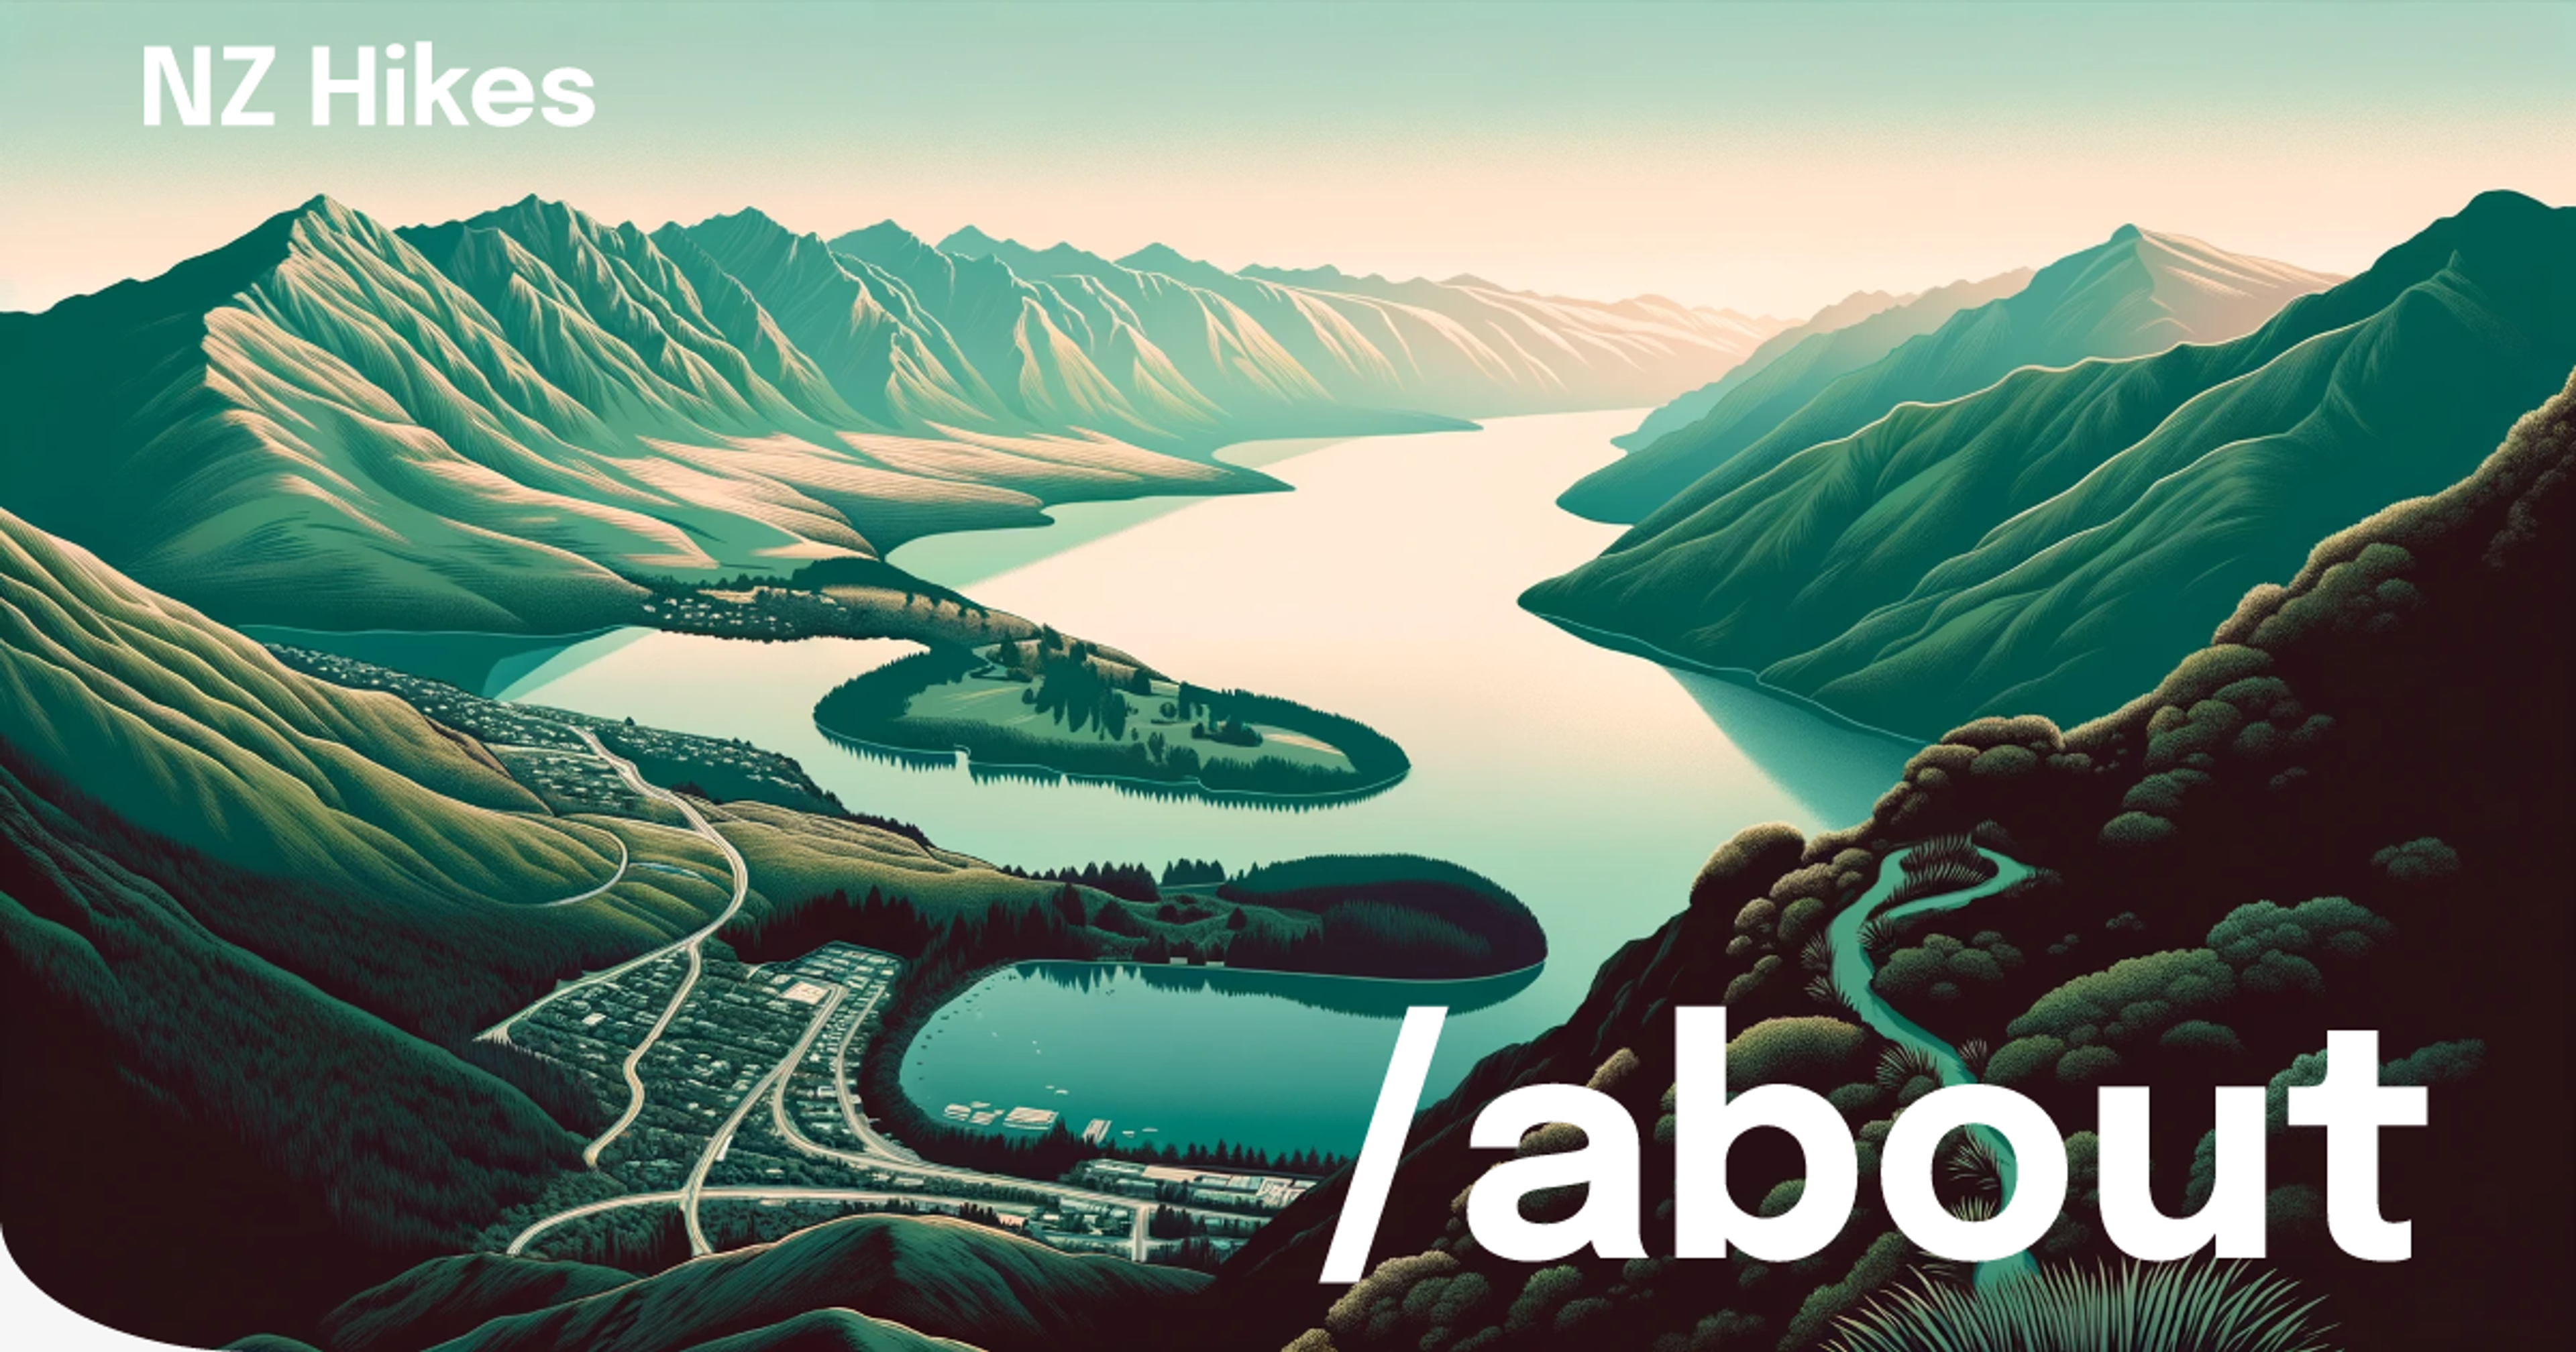
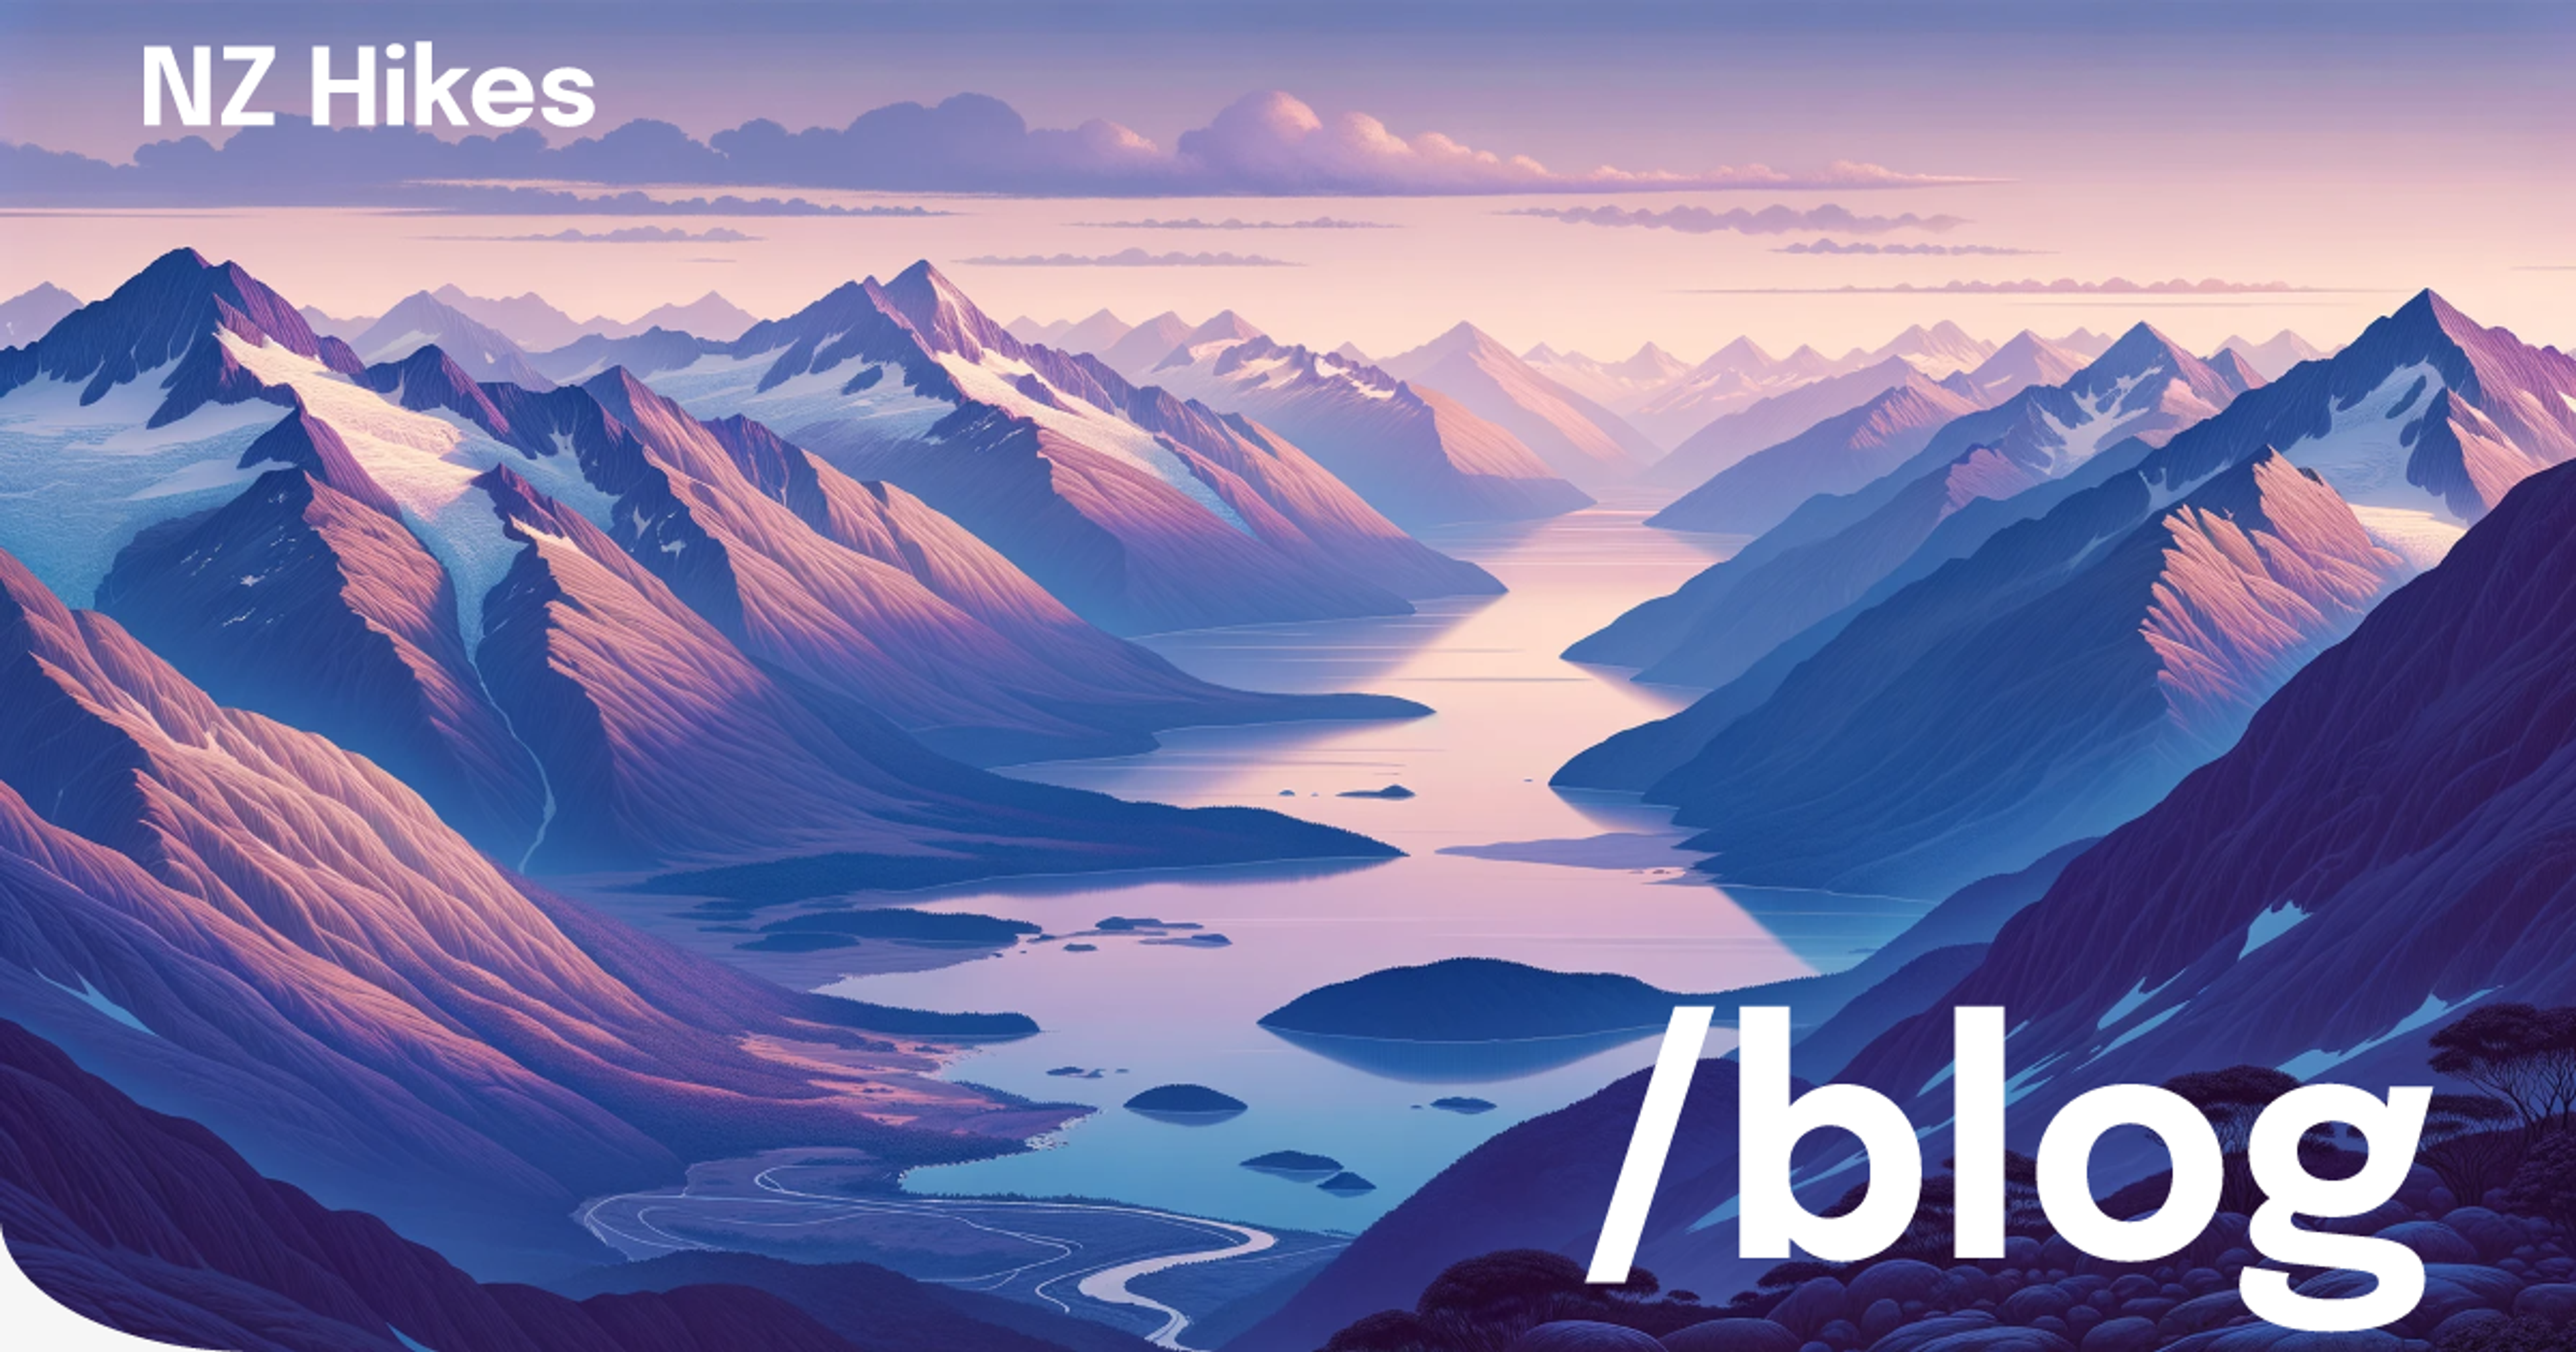
In this example, the API route dynamically fetches the hero image from Sanity based on the page slug. It then creates a visually striking OG image that features the hero image in the background, overlaid with the site title and the slug of the page. The final image is returned in the correct dimensions for OG images (1200x630 pixels) and uses a custom font loaded from a local file.
The following produces the following results in practice:


And the preview for some of the platforms looks like:

Creating OG Images using Mapbox Static Image API
For the hiking pages, I wanted the OG images to be even more informative by including a map of the hiking trail. This was achieved using the Mapbox Static Image API, which allows for the creation of static maps with custom overlays and styles.
Formatting GeoJSON for Mapbox:
The first step was transforming the trail’s GeoJSON data into a format that the Mapbox API could interpret. GeoJSON files contain geographical data, including the latitude and longitude coordinates of the hiking trail. To create the OG image, I needed to convert this data into an array of coordinates. These coordinates were then encoded into polylines, a compact format that Mapbox uses to represent paths on a map.
longside the encoded polyline, the Mapbox API requires a center point for the map and a zoom level to display the trail appropriately. For my OG images, I calculated the center point as the geographical midpoint of the hike. This gives a balanced view of the entire trail. The zoom level, on the other hand, was calculated dynamically based on the trail’s minimum and maximum latitude and longitude. This ensures the trail fits perfectly within the map boundaries, providing a clear and comprehensive view.
Implementing the OG Image Generation
Here's how I implemented the dynamic OG image generation in the route.tsx file under the /app/api/oghike directory. The code handles fetching the trail data from Sanity, processing the GeoJSON to create the polyline, and generating the OG image with the Mapbox Static Image API:
1import { limitCoordinates } from '@/lib/map/limitCoords';
2import { loadHike } from '@/sanity/loaders/loadQuery';
3import { toTitleCase } from '@/lib/helpers/textUtils';
4import { getFileAsset } from '@/sanity/lib/file';
5import { ImageResponse } from 'next/og';
6
7export const runtime = 'edge';
8var polyline = require('@mapbox/polyline');
9
10export async function GET(request: Request) {
11  const { searchParams } = new URL(request.url);
12  const hike = searchParams.get('hike');
13
14  const { data } = await loadHike(hike as string);
15  const { title, route, information } = data;
16  const { elevationGain, distance, region, duration } = information;
17
18  const geoJsonFile = getFileAsset(route?.geoJsonRoute as string);
19  const geoRoute = await fetch(geoJsonFile?.url).then((response) =>
20    response.json(),
21  );
22
23  const coords = limitCoordinates(
24    geoRoute.geometry.coordinates.map((geo: number[]) => [geo[1], geo[0]]),
25  );
26
27  const startingMiddleCoordinates = coords
28    .reduce(
29      (acc: number[], val: number[]) => [acc[0] + val[0], acc[1] + val[1]],
30      [0, 0],
31    )
32    .map((sum: number) => sum / coords.length);
33
34  const minLat = Math.min(...coords.map((coord: number[]) => coord[0]));
35  const maxLat = Math.max(...coords.map((coord: number[]) => coord[0]));
36  const minLon = Math.min(...coords.map((coord: number[]) => coord[1]));
37  const maxLon = Math.max(...coords.map((coord: number[]) => coord[1]));
38  const referenceSpan = Math.max(maxLat - minLat, maxLon - minLon);
39  const zoomLevel = Math.log2((360 * 800) / (referenceSpan * 512));
40
41  const poly = polyline.encode(coords);
42
43  const fontData = await fetch(
44    new URL('public/fonts/Epilogue-Bold.ttf', import.meta.url),
45  ).then((res) => res.arrayBuffer());
46
47  const ogImage = (
48    <div style={{ display: 'flex', flexDirection: 'row', height: '100%' }}>
49      <div
50        style={{
51          display: 'flex',
52          flexDirection: 'column',
53          height: '100%',
54          width: '40%',
55          padding: '20px 20px',
56          justifyContent: 'center',
57          backgroundColor: '#3A7E82',
58          color: 'white',
59        }}
60      >
61        <h1 style={{ fontSize: '64px' }}>{`${title}`}</h1>
62        <h2 style={{ fontSize: '32px' }}>{`🥾 ${toTitleCase(region)}`}</h2>
63        <div
64          style={{
65            display: 'flex',
66            flexDirection: 'row',
67            gap: '1.25rem',
68            fontSize: '24px',
69            marginTop: '1.25rem',
70          }}
71        >
72          <div>{`📏 ${distance}km`}</div>
73          <div>{`⏱️ ${duration}`}</div>
74          <div>{`🏔️ ${elevationGain}m`}</div>
75        </div>
76      </div>
77      <img
78        width={720}
79        height={630}
80        src={`https://api.mapbox.com/styles/v1/mapbox/outdoors-v12/static/path-2+050F27(${encodeURIComponent(
81          poly,
82        )})/${startingMiddleCoordinates[1]},${startingMiddleCoordinates[0]},${
83          zoomLevel * 0.9
84        },0/800x660?access_token=${process.env.NEXT_PUBLIC_MAPBOX_TOKEN}`}
85      ></img>
86    </div>
87  );
88
89  // Return the image response
90  return new ImageResponse(ogImage, {
91    width: 1200,
92    height: 630,
93    emoji: 'openmoji',
94    fonts: [
95      {
96        name: 'Epilogue',
97        data: fontData,
98        style: 'normal',
99      },
100    ],
101  });
102}
OG images have a resolution of 1200x630 pixels. To ensure that the custom map generated by the Mapbox Static Image API fits seamlessly into this format, the static image must also adhere to these exact dimensions.
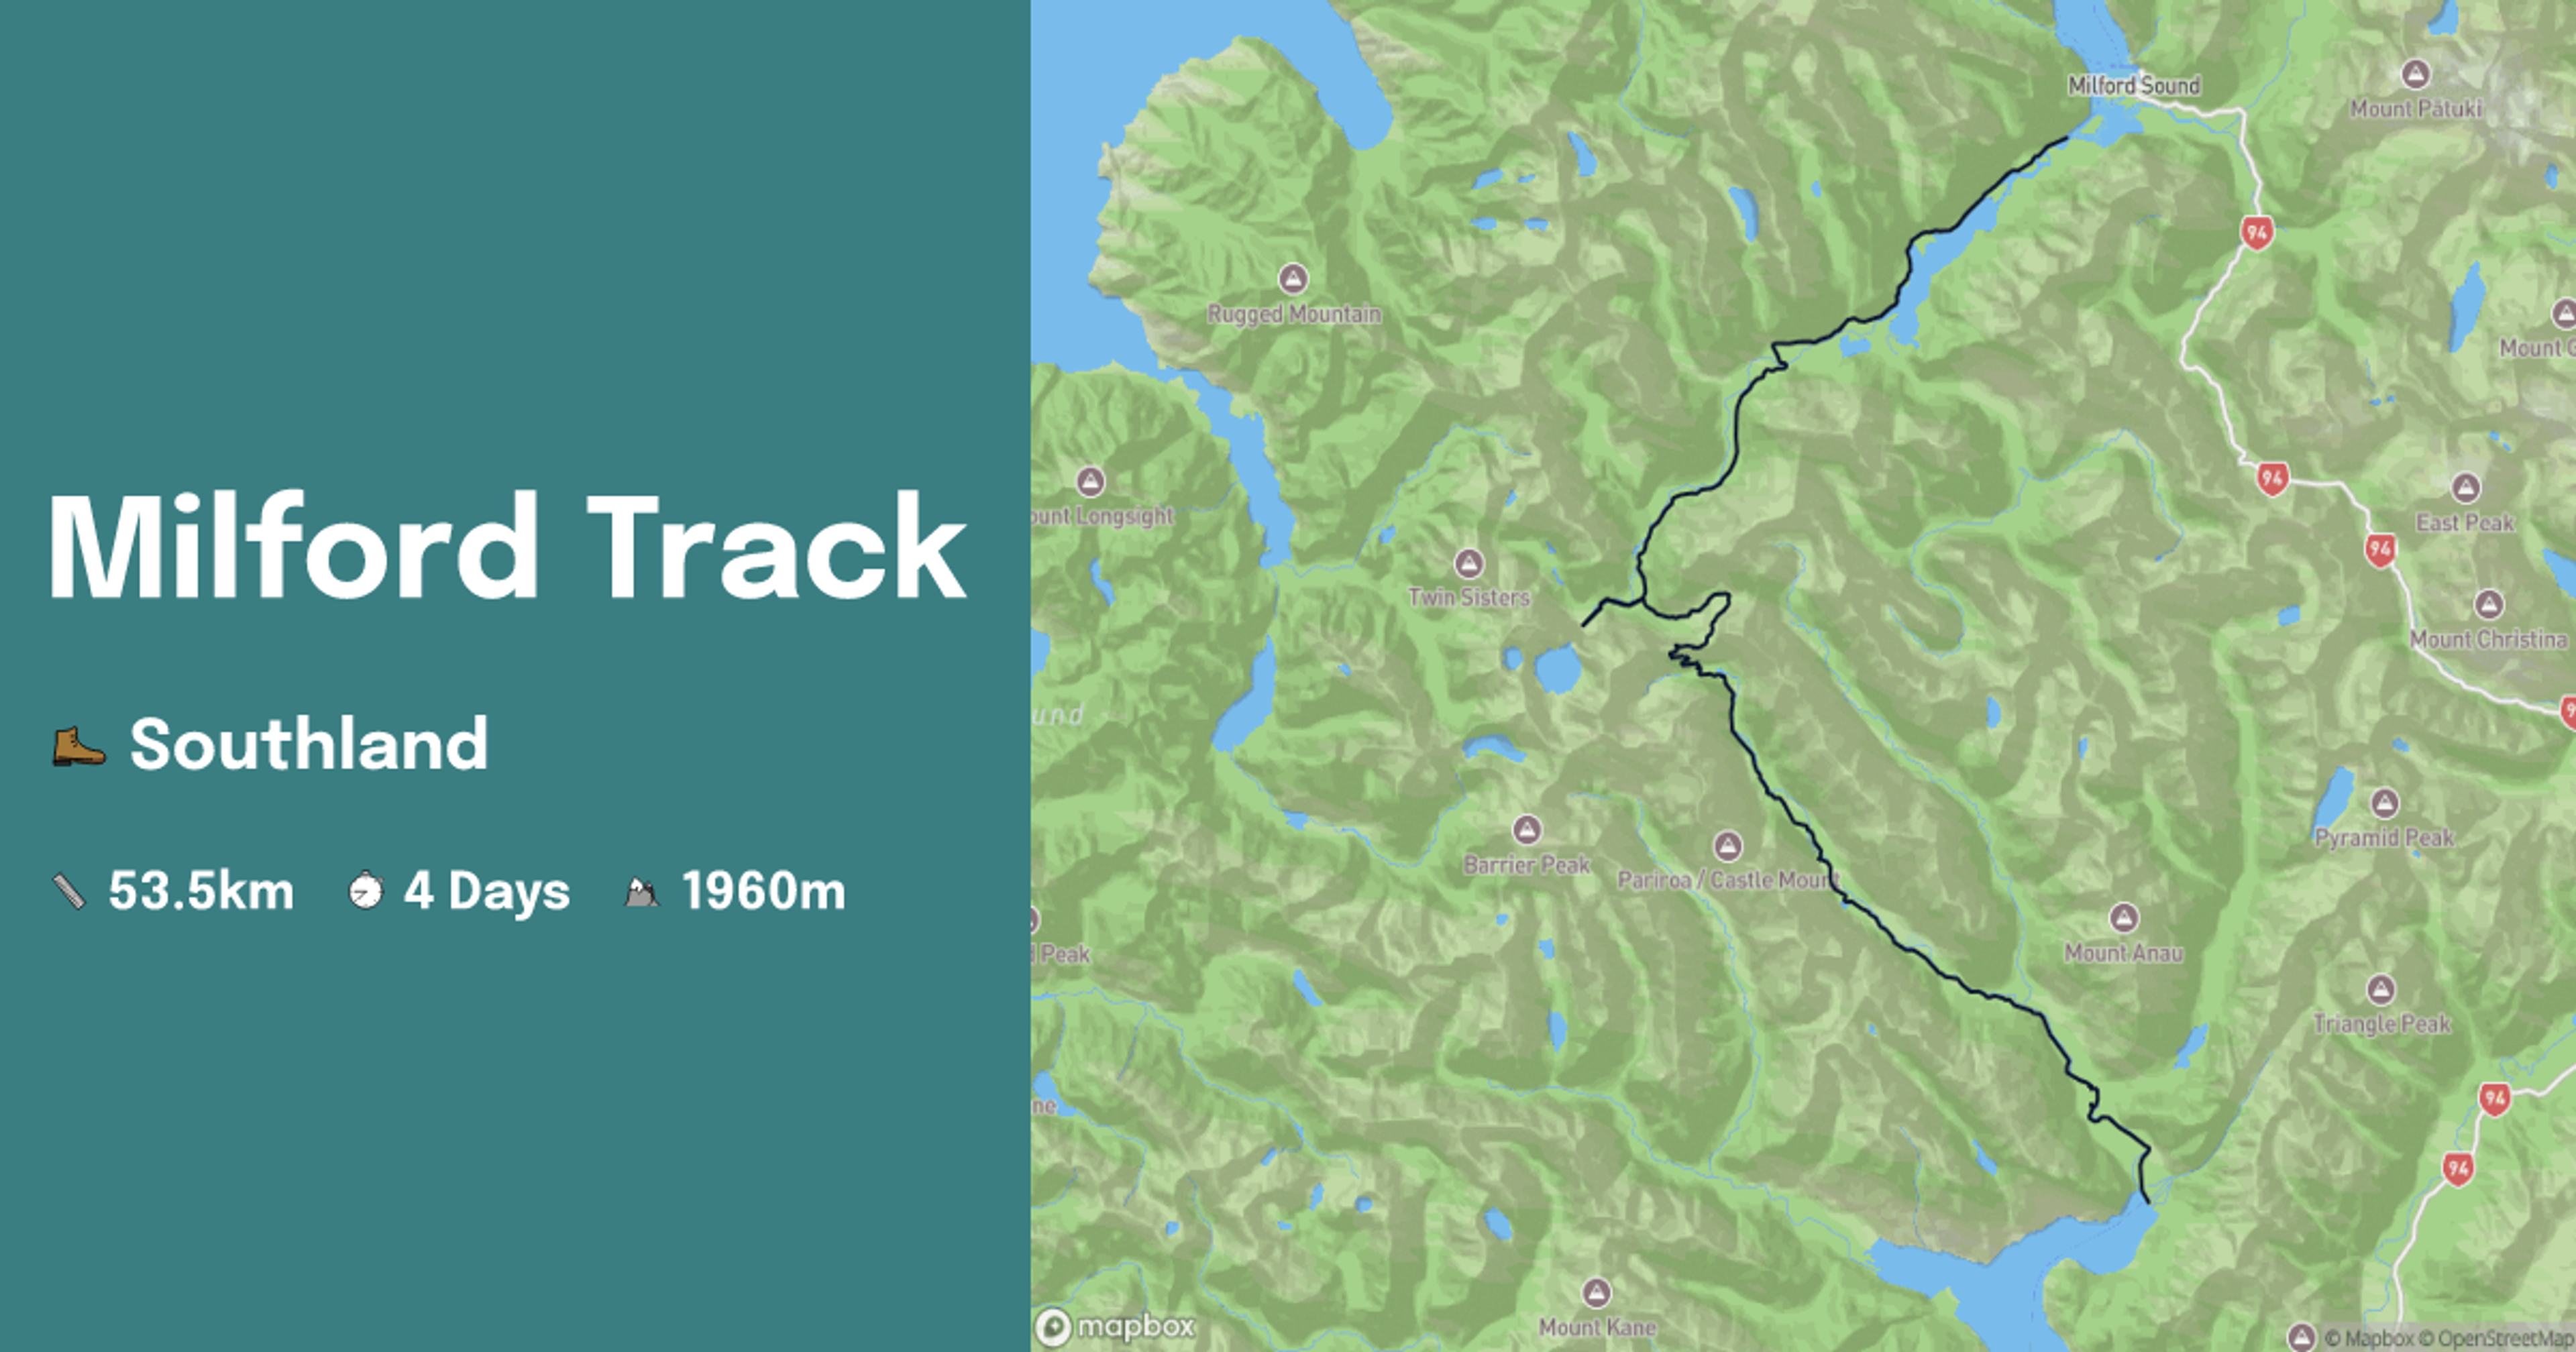
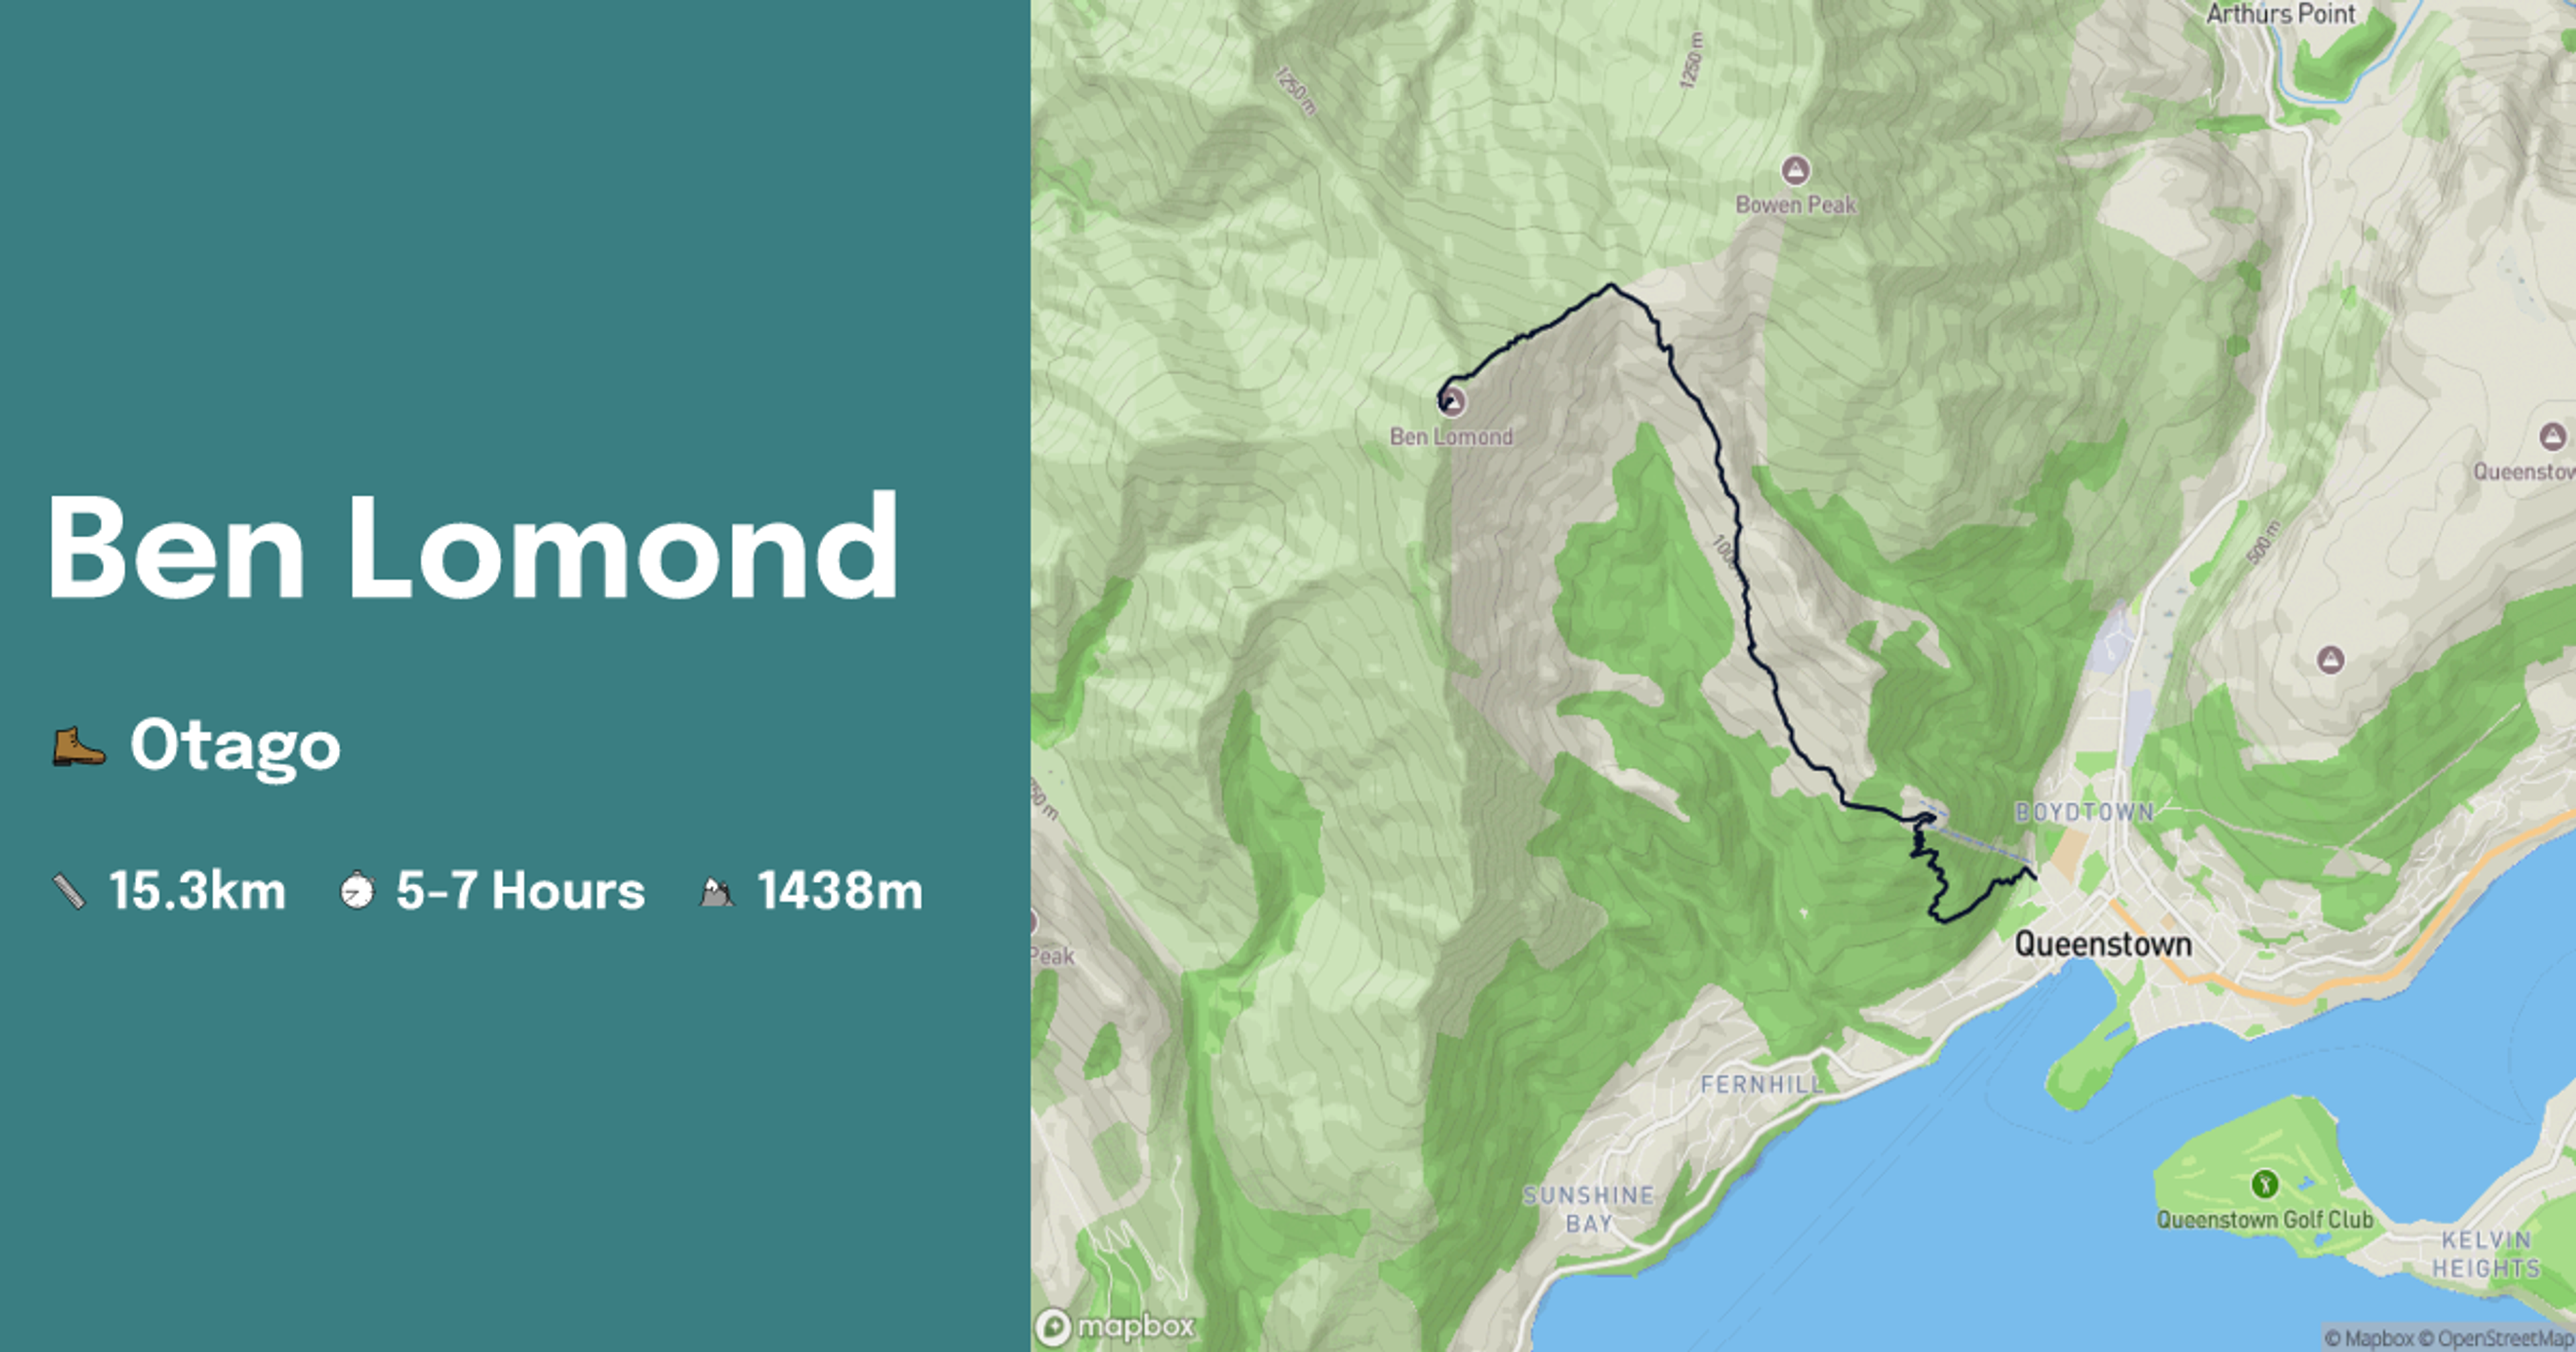
The result is a dynamically generated OG image that is both visually striking and highly informative. By incorporating a map of the trail alongside essential hike details—such as the title, region, distance, duration, and elevation gain—these OG images serve as a compelling preview when shared on social media platforms. Some examples are below:


Overall, this approach to OG image creation significantly enhances the discoverability and share-ability of these hiking pages. When these images appear on social media or group chats, they instantly convey both the beauty and challenge of the trail, encouraging more users to explore the content further.
Resources: